SEO dies in companies where nobody can answer "what did we get for it?". Not because it failed, but because nobody connected the work to money. Measuring SEO ROI is entirely doable with free tools and a little discipline. Here is the framework we use in client reporting.
The metric stack: four layers
Each layer answers a different question, and they only make sense together.
Layer 1: Rankings
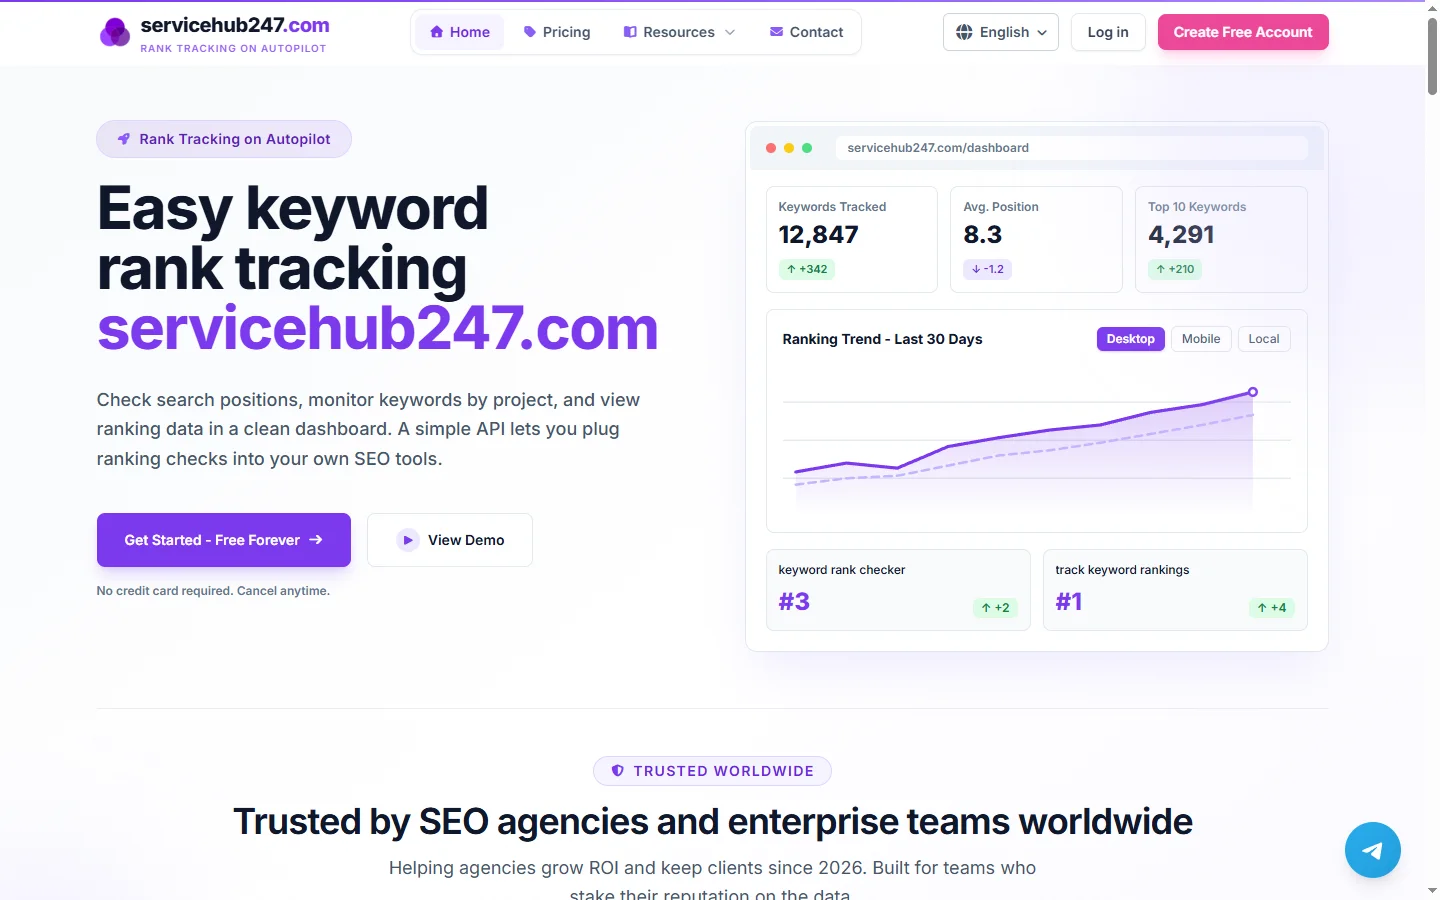
The leading indicator. Keywords in the top 3, top 10 and total, tracked daily with timestamps so progress is provable. This is your earliest signal that work is working, weeks before traffic moves. A tracker like Service Hub 247 gives you the history and the white-label report in one place.
Layer 2: Traffic
Organic sessions and, more importantly, organic sessions to pages that can convert. Segment brand versus non-brand queries in Search Console: non-brand growth is what SEO earned; brand growth is marketing working overall.
Layer 3: Conversions
Leads, signups, calls, purchases from organic sessions. This requires conversion tracking set up properly in your analytics, worth every minute of setup pain.
Layer 4: Revenue
Multiply organic conversions by close rate and average deal value. For e-commerce, read it directly. Now SEO speaks the language of the people who approve budgets.
Handling attribution honestly
Buyers touch many channels before paying. Rather than fighting over last-click credit, report a range: last-click organic revenue as the floor, assisted revenue as the upside, and say so explicitly. Decision makers trust ranges with clear logic more than suspiciously precise single numbers.
Reports people actually read
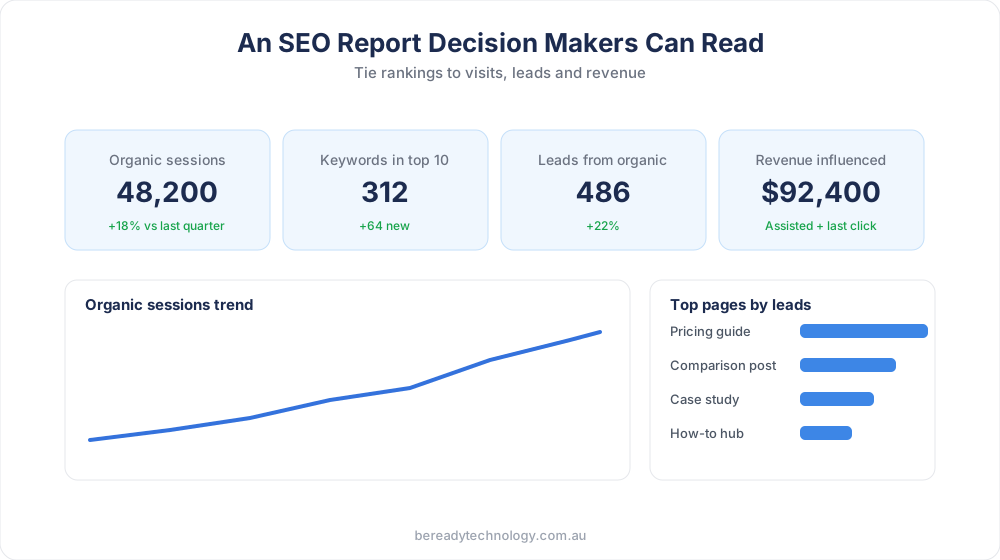
- One page. Four headline numbers: sessions, keyword positions, leads, revenue influenced, each with trend versus last period.
- Annotate causes. "Rankings jumped after the March technical fixes" turns data into a story of cause and effect.
- Show the compounding. A 12-month traffic chart makes the strategic case better than any monthly snapshot; SEO charts bend upward over time, as we explain in How Long Does SEO Take? An Honest Timeline with Milestones.
- List next actions. Every report ends with what happens next and why.
Calculating the R in ROI
Total the costs honestly: content, tools, development time, agency fees. Compare against organic revenue on a 12-month window, because SEO assets keep paying after the invoice. Most mature programs land between 3x and 10x, and unlike ads, the asset does not vanish when spending pauses.
Start before you need it
The most common reporting mistake is starting to measure when someone asks. Record baselines on day one: rankings, traffic, conversions. Six months later, the before-and-after is your budget defense, timestamped and inarguable.